
SQL Server Query Store Overview
Query Store came out in SQL Server 2016. It was the next evolution of Microsoft’s attempts to provide valuable performance data. In this post you’re going to learn a bit about the history of native monitoring in SQL Server, why you should be using the Query Store, as well as how to view the information made available in SQL Server Query Store. This post is just an overview meant to get you to jump into using the feature. This feature is rich enough that someone can present on it easily for an entire day.
A Very Brief History of Native Monitoring in SQL Server
Query Store came out in SQL Server 2016. It was the next evolution of Microsoft’s attempts to provide valuable performance data. With SQL Server 2005, the Dynamic Management View and Dynamic Management Functions were a giant leap forward in terms of providing data about what was going on inside SQL Server. Performance tuning with those objects opened up a whole new world of insight. The “Waits and Queues” methodology for performance tuning rapidly sprung up.
The Data Collection and Management Data Warehouse feature, new in SQL Server 2008, collects both server and database level performance metrics. Deployment of this feature is possible on both a single instance of SQL Server and across multiple instances. That data could then be centralized and viewed through a series of reports.
Extended Events also came out in SQL Server 2008. Despite being a lighter weight replacement for SQL Server Profiler, Extended Events was a bit unwieldy and there was no UI. Adoption was slow.
In SQL Server 2012, Microsoft built a UI for Extended Events, and that helped improve adoption. Extended Events opened up a wealth of information that Profiler cannot offer.
Then in SQL Server 2016, the Query Store came on the scene. Now that we’ve arrived at this feature, let’s talk about it!
Why Use SQL Server Query Store?
- Query Store solves the challenge of persisting performance data over time.
The feature collects and persists information about query performance by gathering the queries that are ran in a particular time interval, their query plans and aggregated runtime performance data for those queries. To do this natively, you would need to run extended events continuously and capture a lot of data. Then that data would need to be persisted and done so in a way that allows for easy analysis later. Capturing query text, the plans and other data about query performance isn’t free, even with something like Extended Events. Also, query plans are pushed out of memory as time goes on and, of course, every time you restart the SQL Server valuable performance data is lost. Query Store solves this problem.
2. Persisted data in Query Store allows for detecting issues related to query plan changes.
The feature allows the DBA to track queries across time and displays all the different query plans associated with the query, up to the default of 200 execution plans per query. When a plan changes, the Query Store reports bubble up this information. The information also includes aggregated runtime data associated with each plan. Detecting this sort of issue without Query Store is much more challenging.
3. With Query Store you can see query performance across time and from a variety of perspectives.
Microsoft added query wait statistics to the feature in SQL Server 2017. Bar graphs in the Query Wait Statistics report show categories of wait types. Queries that contribute to that wait type, such as CPU, Memory, Lock etc. , are visible in the report. The DBA then has valuable insight into waits experienced by queries thanks to Query Store. This report can be based on Total Wait Time, like below, or Avg, Min, Max, and Standard Deviation. Left clicking on the wait category shows the queries contributing to that wait type.

Example report for Query store Wait Statistics report
With the built-in Query Store reports, the DBA can see expensive, poor performing queries with the highest CPU, duration, logical reads and more. This data can also be based on totals, averages min/max and standard deviation. By doing so, Query Store offers insight into the most expensive, painful queries that are hurting performance during any particular time slice and across days of history retained in the Query Store.
4. You can view missing index recommendations for expensive queries using Query Store. Now, you shouldn’t go out and blindly apply the recommendations, but this does offer you the chance to analyze existing queries and the missing index recommendation to see if index cleanup and consolidation needs to happen. This process can benefit not only the query with the missing index recommendation, but other queries in the workload as well.
How To Enable the SQL Server Query Store
Enabling the Query Store is simple enough with two lines of T-SQL, but there are some defaults and options that you should understand before you enable the feature. Not all defaults are going to be desirable and you’ll learn which ones you should adjust as we progress. I will be showing you this in SQL Server 2017.
Below is what the query store UI looks like when initially opened and Query Store is not enabled. To get to this, open SSMS and connect to a SQL Server that is at least version 2016. then drill down into the databases folder and right click a database name and left click the “Properties” option. Then left click Query Store on the left in the “Select a Page” area.
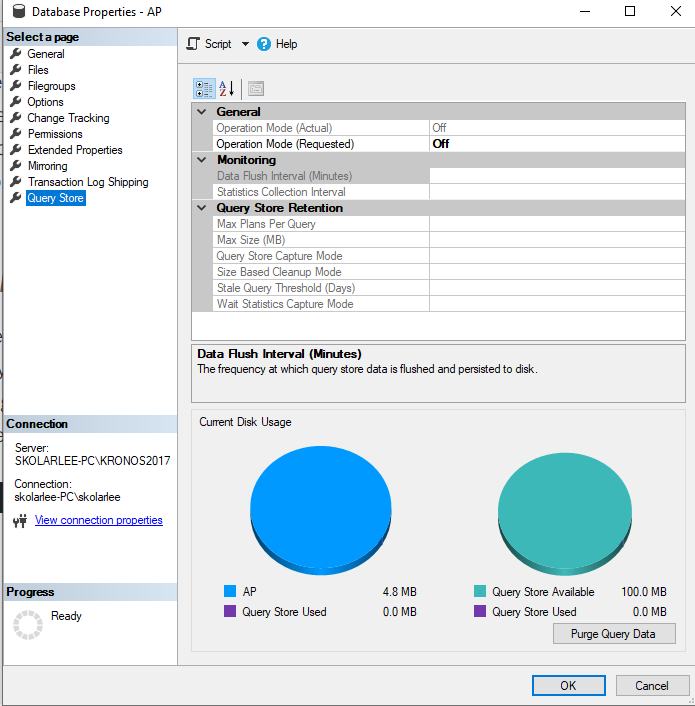
Initial Query Store Screen Before Enabling
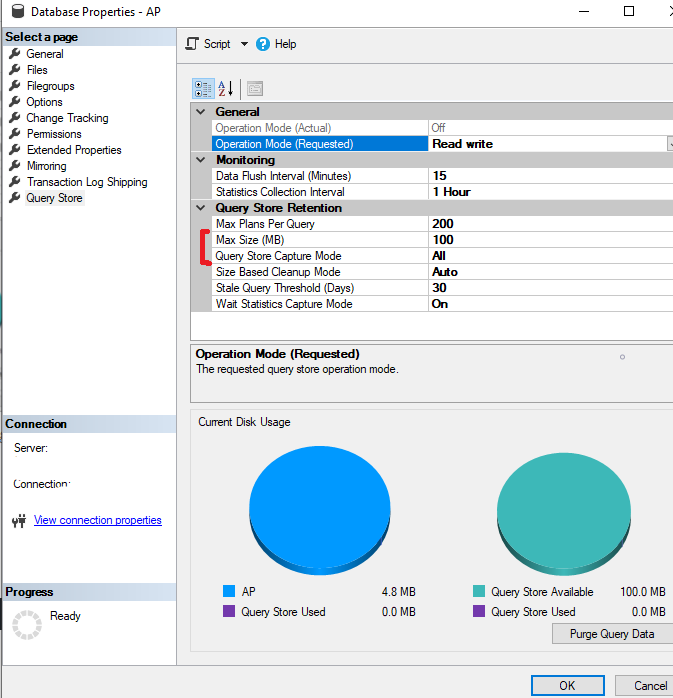
Now, when you left click on the drop down menu for Operation Mode(Requested) you get options for Read Only and Read write. To enable the query store and have it capture performance data, select the Read write option. Now you have a screen that looks like the below. Please note the two options I have bracketed in red. You will want to change these options and we will discuss that as I explain what these options do.
Defaults for the Query Store
Query Store does not write collected data synchronously, but asynchronously. The “Data Flush Interval (Minutes)” value controls how long collected query data sits in memory before being written to disk. There is a trace flag that controls whether the data is written to disk prior to a shutdown as well as one that controls whether the data in Query Store is loaded first before a database comes online.
The “Statistics Collection Interval” also known as Interval_Length_Minutes, determines the time period over which aggregations of the data occur. Valid values are (1, 5, 10, 15, 30, 60, 1440). The smaller the value, the more granular your data will be and the more space that will be used by the feature.
The defaults for the following options should be changed. “Max Size (MB)” controls how large the Query Store can be and works in conjunction with a couple of different settings. The default size is 100 MB, and that is simply too small to store data on SQL Servers with much of a workload. The recommended setting for this is 2048 MB from Erin Stellato of SQLSkills.com. That is a starting point and size can be monitored from there.
The setting “Query Store Capture Mode” in SQL Server 2017 defaults to “All”. This captures even queries with virtually no impact on performance metrics like CPU, duration, logical reads, etc. It is unlikely that you need to capture every single query ran. It is probably better to set this to “Auto”.
The amount of space used by this feature is also influenced by the Size Based Cleanup Mode setting. The default is auto and it should be left that way. When the storage size for Query Store gets close to the maximum set in Max Storage Size (MB), then a clean up process kicks in, removing older data.
The space used is also influenced by the “Stale Query Threshold (Days) ” setting. The default is 30 days and this controls how much query performance history is persisted. The default is a good starting point and depending on needs, you may want to keep more so you can see changes over a longer period of time. You might choose to do this if you really have no Dev or QA environment to speak of at your employer so most development is done in production. You know you shouldn’t be doing that, but I also know that many DBAs don’t work in the ideal, perfect environment.
As mentioned earlier, the “Wait Statistics Capture Mode” is available and on by default. If you leave it on, which is recommended, you get the benefits discussed earlier. You also will have a larger footprint for your Query Store so this is another option that influences size.
Once you have all of these options configured, simply press OK in the SSMS dialog.
If you prefer to use T-SQL, below is a sample script to enable this feature and change the two settings discussed above that are not great defaults.
USE [master]
GO
ALTER DATABASE [MyDB] SET QUERY_STORE = ON
GO
ALTER DATABASE [MyDB] SET QUERY_STORE (OPERATION_MODE = READ_WRITE, MAX_STORAGE_SIZE_MB = 2048,
QUERY_CAPTURE_MODE = AUTO)
GO
Next Steps to Take
- Consider your current monitoring solutions and consider making Query Store part of your approach to performance tuning.
- If you like reading books, Tracy Boggiano and Grant Fritchey have a great book on Query Store.
- If you would like help with anything in this post, or with something else related to SQL Server, reach out to me here, or on Twitter, and I’ll be glad to offer assistance.